[Annual]
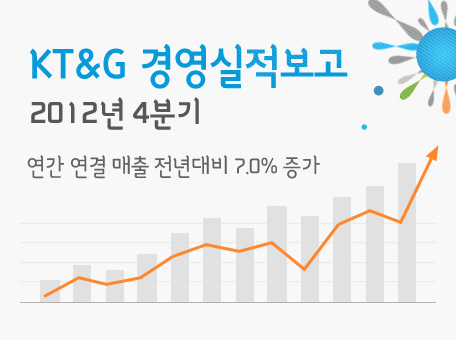
□ KT&G’s annual consolidated sales for 2012 exhibited a
year-on-year increase of 7.0%, and operating income showed a year-on-year
decrease of 5.0%.
[Consolidated Figures]
◦ Sales: ₩3,723 billion in 2011→ ₩3,984.7 billion in
2012, 7.0% ↑
◦ Operating
Income: ₩1,090.3 billion in 2011→ ₩1,035.9 billion in 2012, 5.0% ↓
□ KT&G’s separate annual sales for 2012 showed a year-on-year
increase of 5.9%, and operating income exhibited a year-on-year increase of
8.3%.
[KT&G’s Separate Sales Figures]
◦ Sales: ₩2,490.8 billion in 2011→ ₩2,637.6 billion in
2012, 5.9% ↑
◦ Operating
Income: ₩898 billion in 2011 → ₩972.7 billion in 2012, 8.3% ↑
-Domestic cigarette sales showed a year-on-year increase of 5.8% (₩1,895.6 billion) thanks to a rise in market share (59.0% in 2011 → 62.0%% in 2012, 3.0%p↑).
-Cigarette export sales exhibited a year-on-year increase of 5.1% (₩628.2 billion) thanks to increased sales in new markets and a rise
in unit export price.
-Real estate sales showed a year-on-year increase of 5.6% (₩43.5 billion) due to increased lease sales.
[Q4]
□
The consolidated sales figures for 2012 Q4 were on the same
year-over-year level, and operating income showed a year-over-year decrease of
15.0%.
[Consolidated Figures (3 months)]
◦ Sales: ₩954.1 billion in Q4, 2011 → ₩954.4 billion
in Q4, 2012, 0.03% ↑
◦ Operating
Income: ₩213.3 billion in Q4, 2011 → ₩181.3 billion in Q4, 2012, 15.0% ↓
□ Separate sales for Q4, 2012 for KT&G only showed a
year-over-year decrease of 0.4%, and operating income exhibited a
year-over-year decrease of 8.3%.
[KT&G’s Separate Sales Figures (3 months)]
◦ Sales: ₩658.6 billion in Q4, 2011→₩656.2 billion in
Q4, 2012, 0.4% ↓
◦ Operating
Income: 207.9 billion in Q4, 2011→190.6 billion in Q4,
2012, 8.3% ↓
- Domestic cigarette sales showed a year-over-year increase of 0.5% (₩445.3 billion) thanks to a rise in market share (57.3% in Q4, 2011→ 59.4% in Q4, 2012, 2.1%p↑).
- Cigarette export sales exhibited a year-over-year increase of 0.7% (₩179.3 billion) thanks to a rise in unit sale price.
- Real estate sales showed a year-over-year decrease of 36.8% (₩12.3 billion) due to a reduction in selling of lots.
□
KT&G’s subsidiary Korea Ginseng Corporation showed a
year-on-year decrease of 11.5% in annual sales for 2012, with operating income
exhibiting a year-on-year decrease of 33.7%, due to sluggish demand from
stagnant domestic consumption and shrinking consumer confidence.
[Korea Ginseng Corporation’s annual sales figures for 2012]
◦ Sales: ₩940.1 billion in 2011→ ₩831.9 billion in
2012, 11.5% ↓
◦ Operating
Income: ₩200.8 billion in 2011→ ₩133.1 billion in 2012, 33.7% ↓


